MAKE A MEME
View Large Image

| View Original: | Butterworth Filter Orders.svg (850x600) | |||
| Download: | Original | Medium | Small | Thumb |
| Courtesy of: | commons.wikimedia.org | More Like This | ||
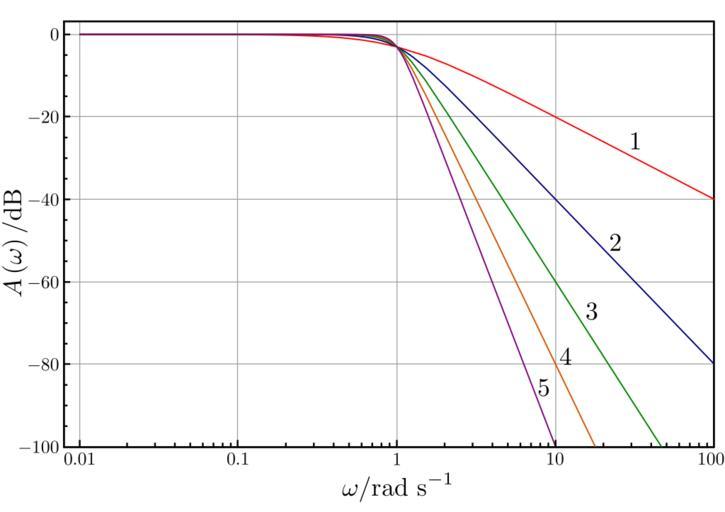
| Keywords: Butterworth Filter Orders.svg A frequency-response graph of low-pass butterworth filters of orders from 1 to 5 The break frequency is normalised to 1 rad/s and the DC-gain is normalised to 0dB Note this is the power gain G<sup>2</sup> not the amplitude gain own 2007-10-18 Inductiveload Mathematica Code Requires the following package <<Graphics`Graphics` <pre><nowiki> butterworthw_ w0_ o_ 1/ 1 + w/w0 2 o ; LogLinearPlot EvaluateTable 10 Log10 butterworthw 1 ord ord 5 w 0 01 100 PlotRange -> -100 0 PlotPoints -> 100 ImageSize -> 800 </nowiki></pre> Butterworth filters Lowpass filters | ||||