MAKE A MEME
View Large Image

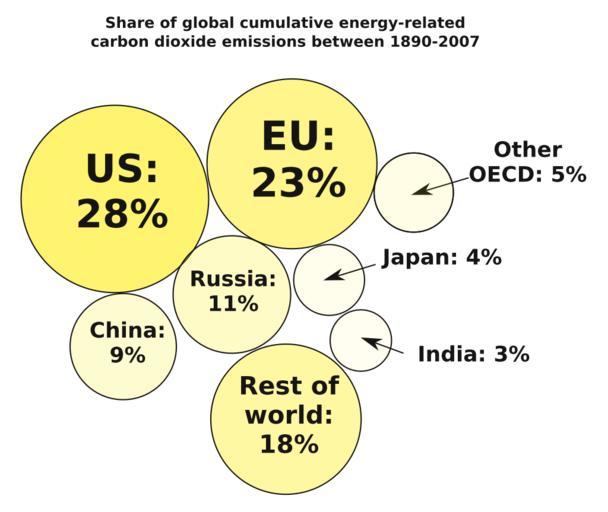
| View Original: | Bubble diagram showing the share of global cumulative energy-related carbon dioxide emissions for major emitters between 1890-2007.svg (726x612) | |||
| Download: | Original | Medium | Small | Thumb |
| Courtesy of: | commons.wikimedia.org | More Like This | ||
| Keywords: Bubble diagram showing the share of global cumulative energy-related carbon dioxide emissions for major emitters between 1890-2007.svg carbon dioxide emissions between 1890-2007 Major emitters are shown percentage share in brackets the United States 28 the European Union 23 Russia 11 China 9 other OECD countries 5 Japan 4 India 3 and the rest of the world 18 Data are from IEA 2009 For more information see greenhouse gas The area and colouring of the circles is proportional to the share of emissions The radius of the circles equals the square root of area / References IEA 2009 http //www worldenergyoutlook org/media/weowebsite/2009/WEO2009 pdf World Energy Outlook 2009 p 180 p 182 of PDF http //www iea org/ International Energy Agency IEA Paris France ISBN 978-92-64-06130-9 own Enescot 2012-11-13 Data Data from the IEA 2009 are given below as comma-separated values CSV The data were exported from OpenOffice 3 4 1 Calc using the following options enclosed in braces Character set Western Europe Windows-1252/WinLatin ; Field delimiter ; text delimiter <pre> Region/country a area r radius d diameter Rest of world 18 2 3936536824 4 7873073648 India 3 0 9772050238 1 9544100476 Japan 4 1 1283791671 2 2567583342 Other OECD 5 1 261566261 2 523132522 China 9 1 6925687506 3 3851375013 Russia 11 1 8712051593 3 7424103185 European Union 23 2 7057581899 5 4115163798 United States 28 2 9854106607 5 9708213214 </pre> Global warming graphs Atmospheric carbon dioxide Cc-zero | ||||