MAKE A MEME
View Large Image

| View Original: | Blast wave standard curve.svg (600x600) | |||
| Download: | Original | Medium | Small | Thumb |
| Courtesy of: | commons.wikimedia.org | More Like This | ||
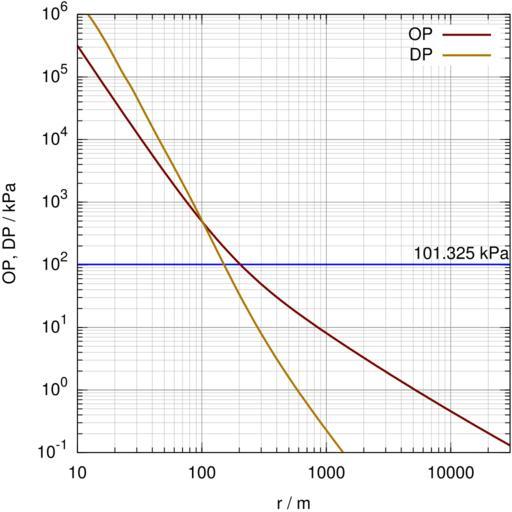
| Keywords: Blast wave standard curve.svg en Standard curves for overpressure and dynamical pressure of a 1-kiloton sea-level free-air burst free-air means without shock reflection Range is in metres pressure in kilopascals The blue line indicates the standard sea-level pressure of 101 325 kilopascals Standardkurven fĂĽr Ă berdruck und dynamischen Druck einer 1-Kilotonnen-Freiluftexplosion d h keine Reflexionen auf Meeresniveau Die blaue Linie gibt den Standarddruck von 101 325 Kilopascal an Own SiriusB 2008-11-21 Image Blast wave standard curve png The graph can be reproduced using this Gnuplot script reset set term svg enhanced size 600 600 font Helvetica 16 ;set output 'pdna svg' unset grid slw 1 2 set style line 1 lt 1 lw 2 0 slw lc rgb ' 770000' set style line 2 lt 1 lw 2 0 slw lc rgb ' aa7700' set style line 3 lt 1 lw 1 5 slw lc rgb ' 0000ff' set style line 4 lt 1 lw 0 5 slw lc rgb ' 606060' set style line 5 lt 1 lw 0 3 slw lc rgb ' a0a0a0' set tmargin 0 7 set bmargin 2 9 set lmargin 8 1 set rmargin 0 2 pdna x 3 04e11/x 3+1 13e9/x 2+7 9e6/ x sqrt log x/445 42+3 exp -sqrt x/445 42 /3 dynamic pressure from overpressure fxi x x/101325 +1 ft x 1 e-12 fxi x 6 fz x log fxi x -0 47 ft x / 100 +ft x gams x 1 402-3 4e-4 fz x 4/ 1 +2 22e-5 fz x 6 mus x gams x +1 / gams x -1 nrho x 1 +mus x fxi x / 5 975+fxi x kq x nrho x -1 /2 qdna x kq pdna x pdna x set logscale SI units set xlabel r / m ; set ylabel OP DP / kPa offset 0 0;runit 1 0000; punit 1000 Imperial units set xlabel r / ft ; set ylabel OP / psi ;runit 0 3048; punit 6894 7573 set xrange 10/runit 30000/runit set yrange 1 e2/punit 1 e9/punit set xtics 10; set mxtics 10 set ytics 10; set mytics 10 set format y 10 2T set grid xtics ytics mxtics mytics ls 4 ls 5 set arrow 1 from graph 0 first 101325 /punit to graph 1 first 101325 /punit nohead ls 3 set label 1 101 325 kPa at 5000 /runit 150000 /punit set key top right unset key plot pdna x runit /punit t 'OP' w l ls 1 \ qdna x runit /punit t 'DP' w l ls 2 reset Nuclear explosion physics SVG diagrams | ||||