MAKE A MEME
View Large Image

| View Original: | Ag annual average USD price 1792-2005.png (640x480) | |||
| Download: | Original | Medium | Small | Thumb |
| Courtesy of: | commons.wikimedia.org | More Like This | ||
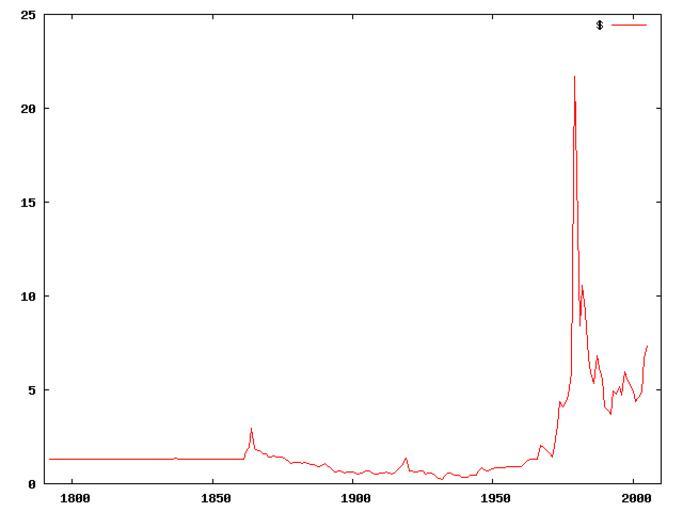
| Keywords: Ag annual average USD price 1792-2005.png Ag_annual_average_USD_price_1792-2005 svg Historic annual average price of an ounce of silver in USD Data from kitco new plot made with gnuplot <pre> 1792 1 293 1836 1 293 1837 1 35 1838 1 296 1840 1 296 1841 1 292 1842 1 293 1843 1 292 1856 1 292 1857 1 294 1858 1 292 1861 1 292 1862 1 709 1863 1 952 1864 2 939 1865 1 889 1866 1 766 1867 1 741 1868 1 569 1869 1 569 1870 1 430 1871 1 412 1872 1 449 1873 1 421 1874 1 411 1875 1 394 1876 1 315 1877 1 212 1878 1 1 1879 1 144 1880 1 116 1881 1 129 1882 1 099 1883 1 11 1884 1 084 1885 1 032 1886 1 006 1887 0 970 1888 0 936 1889 0 959 1890 1 056 1891 0 956 1892 0 840 1893 0 703 1894 0 615 1895 0 677 1896 0 664 1897 0 590 1898 0 603 1899 0 6 1900 0 648 1901 0 558 1902 0 487 1903 0 560 1904 0 612 1905 0 655 1906 0 696 1907 0 552 1908 0 494 1909 0 529 1910 0 553 1911 0 556 1912 0 640 1913 0 584 1914 0 503 1915 0 561 1916 0 758 1917 0 899 1918 1 019 1919 1 336 1920 0 655 1921 0 663 1922 0 643 1923 0 650 1924 0 692 1925 0 692 1926 0 538 1927 0 583 1928 0 577 1929 0 488 1930 0 330 1931 0 304 1932 0 254 1933 0 437 1934 0 544 1935 0 584 1936 0 454 1937 0 438 1938 0 428 1939 0 350 1940 0 348 1941 0 351 1942 0 448 1943 0 448 1944 0 448 1945 0 708 1946 0 867 1947 0 746 1948 0 700 1949 0 733 1950 0 8 1951 0 88 1952 0 833 1953 0 853 1954 0 853 1955 0 905 1956 0 914 1957 0 898 1958 0 899 1959 0 914 1960 0 914 1961 1 033 1962 1 199 1963 1 293 1966 1 293 1967 2 06 1968 1 959 1969 1 807 1970 1 635 1971 1 394 1972 1 976 1973 3 137 1974 4 391 1975 4 085 1976 4 347 1977 4 706 1978 5 93 1979 21 693 1980 16 393 1981 8 432 1982 10 586 1983 9 121 1984 6 694 1985 5 888 1986 5 364 1987 6 79 1988 6 108 1989 5 543 1990 4 068 1991 3 909 1992 3 71 1993 4 968 1994 4 769 1995 5 148 1996 4 73 1997 5 945 1998 5 549 1999 5 218 2000 4 951 2001 4 370 2002 4 600 2003 4 876 2004 6 671 2005 7 316 </pre> Silver price charts Natural resources Economic statistics | ||||