MAKE A MEME
View Large Image

| View Original: | 3d-gradient-colored.svg (720x705) | |||
| Download: | Original | Medium | Small | Thumb |
| Courtesy of: | commons.wikimedia.org | More Like This | ||
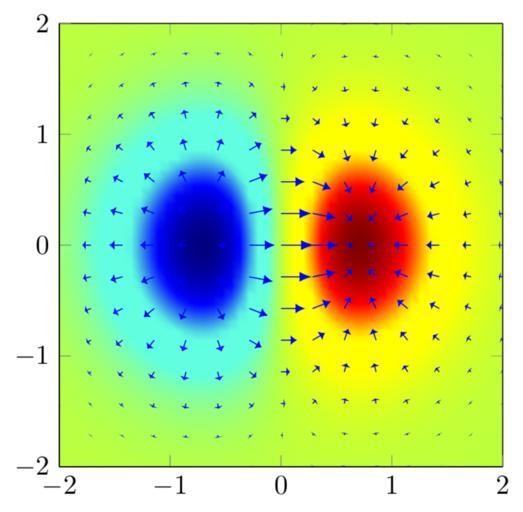
| Keywords: 3d-gradient-colored.svg en Gradient of the function <math>f x y \frac x e x 2 + y 2 </math> is plotted as blue arrows over the pseudo color plot of the function itself de Der Gradient der Funktion <math>f x y \frac x e x 2 + y 2 </math> wurde als blaue Pfeile über der Funktion geplottet die als Farbschema codiert gezeichnet wurde Color-coded plot of a function with its gradient as blue arrows - Equation orange <math>f x y \frac x e x 2 + y 2 </math> - Coordinate System Cartesian - <math>x</math> Range -2 2 - <math>y</math> Range -2 2 - ValidSVG Source is available at https //github com/MartinThoma/LaTeX-examples/ github TikZ diagrams Images by Martin Thoma/Mathematics Mathematical analysis False-colors Cc-zero | ||||