MAKE A MEME
View Large Image

| View Original: | 1st Order Lowpass Filter PRF Log.svg (800x494) | |||
| Download: | Original | Medium | Small | Thumb |
| Courtesy of: | commons.wikimedia.org | More Like This | ||
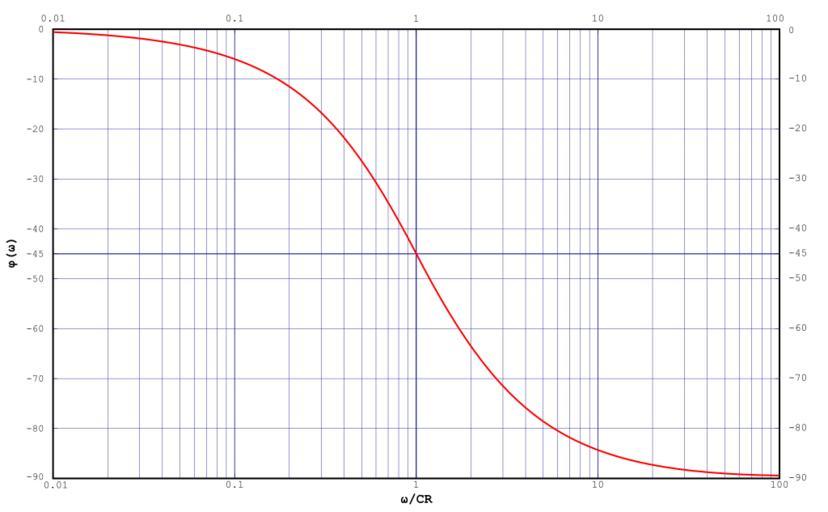
| Keywords: 1st Order Lowpass Filter PRF Log.svg The phase response function of the following 1st-Order Lowpass Filter centre Plotted on log-linear scales from 0 01 to 100 units of RC The phase in in degrees Own drawing Plotted in Mathematica Edited in Inkscape 2007-02-17 Inductiveload Linear Amplitude Response Function Logarithmic Amplitude Response Function Linear Phase Response Function Mathematica Source This code require the following packages to be loaded <pre><<Graphics`Graphics`</pre> <pre> loggrid001 Tablea a 0 01 0 1 0 01 ; loggrid01 Tablea a 0 1 1 0 1 ; loggrid1 Tablea a 1 10 1 ; loggrid10 Tablea a 10 100 10 ; lingrid0neg90 Tablea a -90 0 10 ; neg45 -45 ; phasegrid Unionlingrid0neg90 neg45; logxgrid Unionloggrid001 loggrid01 loggrid1 loggrid10; logxgridlabels 0 001 0 01 0 1 1 10 100 ; phaseplotlog LogLinearPlot-ArcTanω 180/Pi ω 0 01 100 PlotRange -> 0 01 100 -90 0 PlotPoints -> 80 ImageSize -> 800 Frame -> True FrameTicks -> logxgridlabels phasegrid GridLines -> logxgrid phasegrid FrameLabel -> ω/CR ϕ ω </pre> Analog signal processing circuit diagrams | ||||